March 2010 Archives

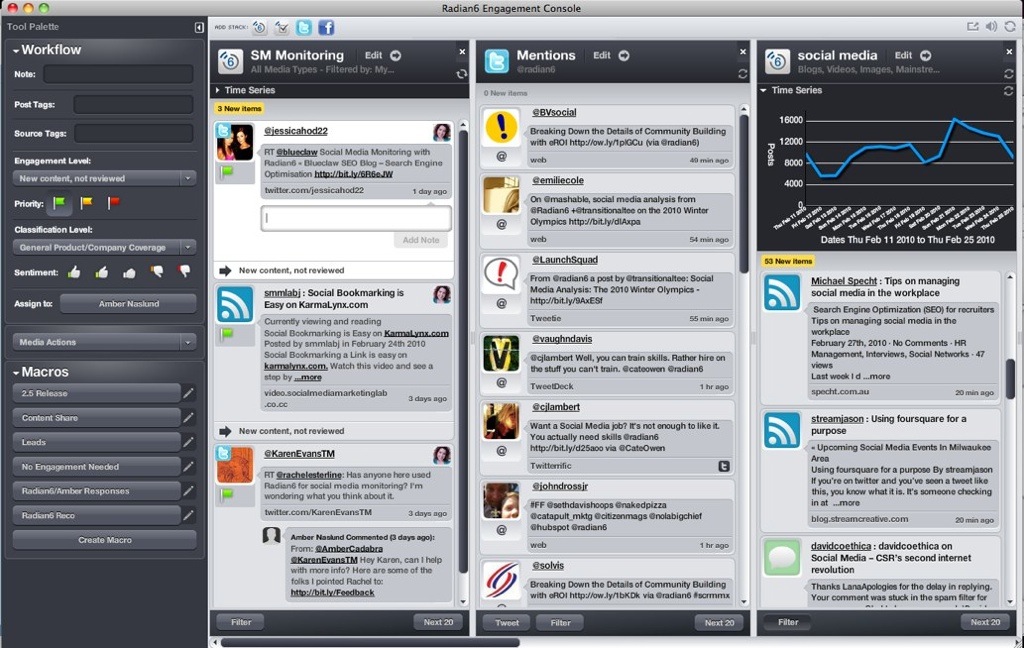
I've tried a lot of different platforms for monitoring and measuring social media in the last few months. Somewhere in the middle of the project, I realized that new users of these systems face not one, but two learning curves. The obvious one—learning the software itself—is the easy part.

Get new software, and you'll spend some time figuring out the features and user interface. That much is obvious. Some vendors try harder than others to make their social media analysis platforms easy to use, but none of them are all that hard to understand.

Compared to other software products most of us have learned, these systems don't really have many features. Refuse to be intimidated, and you can figure it out.

Getting analytical
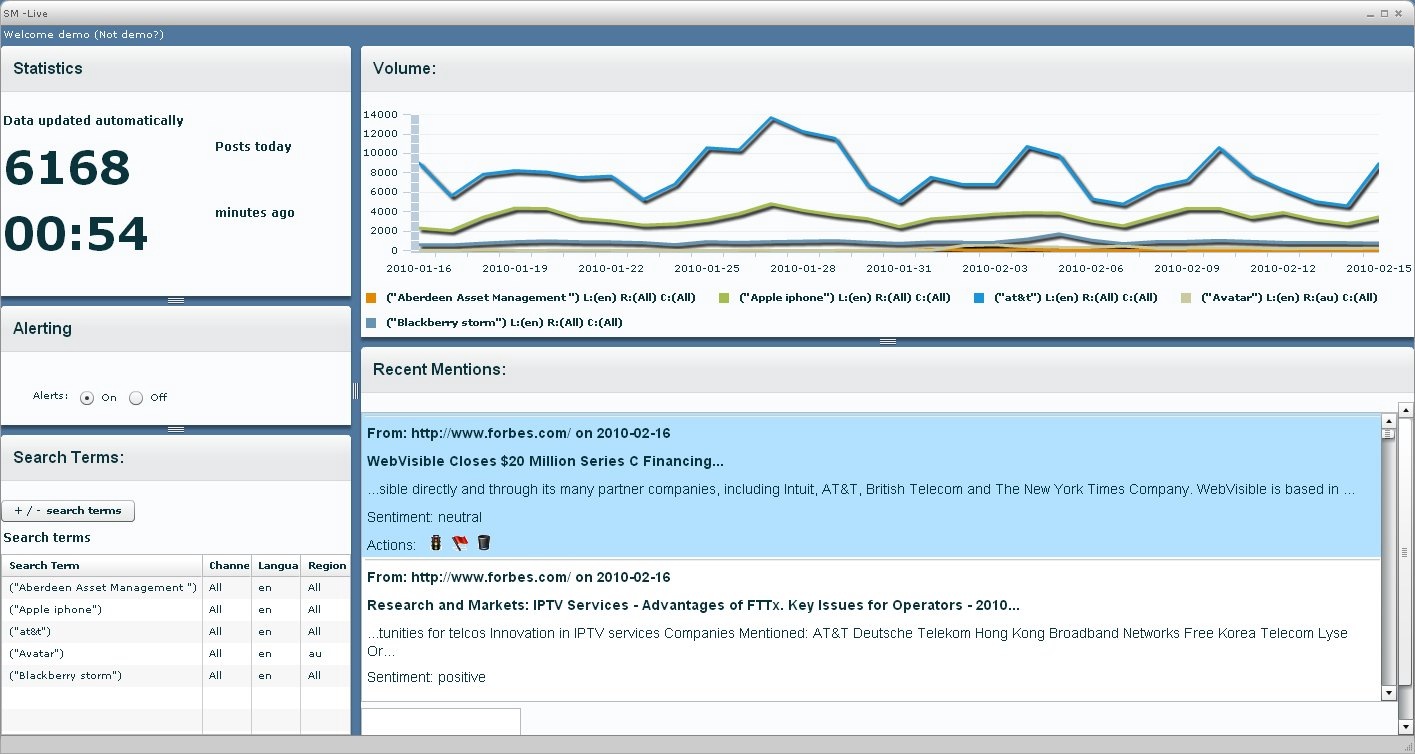
The more challenging learning curve for the new user is in using the tool appropriately—developing the analytical mindset to find meaning in the data. It's easy to fixate on the default charts that virtually every tool provides, but the interesting stuff only starts to happen when you go deeper into the data. On a checklist level, that means developing an understanding of:

  • Queries and topics
    Most platforms use Boolean logic to find relevant content for analysis. Some use the same method to define subtopics, such as competitors or industry trends. Know what the topic does—and doesn't—cover.

  • Analysis and metrics
    The usual list of available analyses is generally short. but it's important to think about how the numbers are calculated and what they mean in a given context.

  • Filters and more queries
    Most platforms allow users to focus on subsets of the data, either by clicking on charts or by selecting filters based on metrics or new queries. Filters and queries can lead to useful information, but it's important to understand what applying a particular set of filters to the data tells you.
As I looked at a lot of platforms, I heard a few companies make a point of emphasizing their ease of use, and it's true that some are easier to learn than others. When the job is to dig into the data and find real insights, though, the software won't do the work for you. If you know what you're looking at—and what you're looking for—learning the software itself is relatively easy.

How many competing products do you have time to evaluate before you need to make a decision? I have some good stuff in my draft folder for next week, but first, let me tell you about the project I just completed. If your company is looking at software options for monitoring or analyzing social media, I can save you a lot of time and effort.

Over the last few months, I've reviewed about 30 companies on the way toward writing a comparison report on 21 social media analysis platforms that are built for workgroup environments. The report, Social Media Analysis Platforms for Workgroups, is now available at the Social Target web site. It has information on all of these companies:

Alterian
Attensity
Attentio
Biz360
Brandwatch
Buzzcapture
Digimind
Dow Jones & Co.
eCairn
Evolve24
Filtrbox
MediaMiser
Networked Insights
Press Army
Radian6
Scout Labs
Sentiment Metrics
Sysomos
Trackur
Visible Technologies
Whitevector


It's possible to get an idea of what's on the market by visiting vendor web sites and reading reviews, but that's not what I do. If you want to know about more than the usual suspects, or if you want answers to questions the vendors don't answer in their marketing materials, it takes a bit more effort—actually, a lot more effort.

Here's my process:

  • Invite everyone
    I've been tracking the companies in this space since 2006, and I published my first buyer's guide in 2007. I have a database of well over 200 companies who offer tools or services for social media analysis, and most of them are on my vendor mailing list. When I started the project, I invited everyone to participate. I made a special point to contact companies that I knew should be in it.

  • Written RFI
    I sent a 36-question request for information, asking for details that sometimes make the vendors squirm. Want to know about sentiment analysis? I asked about the degree of automation and its granularity (document-level vs. entity-level). I got prices and pricing models. I found out how long it takes to get them up and running (from seconds to weeks). I got details—lots of details.

  • Briefings and product demos
    30 companies responded to the RFI, and I took briefings and demos from each, running about 90 minutes each. We talked about their products, their customers, and their businesses. In the process, I learned that some of the companies didn't belong in the report, either because their software was single-user or because their consulting services were an essential piece of the platform. For some reason, the briefings and demos last just as long for the companies that don't end up in the report.

  • Live testing
    Most of the companies gave me access to their platforms for hands-on testing as I wrote about them. There's nothing quite like trying to reproduce the cool demonstration to show how much work went into building it. Switching the user interface to a language I can't read was fun, too. I observed that learning the software itself isn't going to be the major challenge for most companies; the challenge is in understanding how to use the data.

Add hundreds of emails and a bazillion hours of writer's block writing (as counted by my junior associate) to get to 60 pages of finished report, and you have the complete process. It's not a project you want to duplicate.

I'll share some of what I learned in the coming weeks, but this post is getting (getting?) too long already. Please take a look at Social Media Analysis Platforms for Workgroups. If your company is actively searching for the right tool(s) for monitoring, measuring, or mining social media, I think you'll find it's worth the investment.

In the past week, both Radian6 and Sentiment Metrics have announced lightweight clients for their social media analysis platforms. (I'm calling it a slim client because thin client means something else.) The new applications are for users who need to work with SMA platforms but who don't need access to all of their features. It's not hard to imagine how this might lead to slim clients tailored to different needs, since the starting point is a dashboard environment that's already built from widgets.

Take a look; two announcements in one week suggests the start of a trend. Call it "SaaS meets client-server." :-)

Radian6: Engagement Console

Sentiment Metrics: SM Live

Both applications run on Adobe Air, like the popular Twitter client, TweetDeck (note the visual similarity with the Radian6 client). The Radian6 Engagement Console arrives in April; SM Live is due at the end of March.

Sentiment analysis is generating blog headlines again. After reading about the non-response bias of automated sentiment analysis, and that it has no place in social media monitoring, I decided to run a sentiment analysis on sentiment analysis (apparently I like that phrase). I have an account on Biz360 Community from my current project (look for it next week), so I tossed it a quick query and found that the recent buzz was mostly… positive? Hmm.

Here's the thing. Sentiment is not the golden metric. Virtually every social media analysis platform can show you a pie chart on sentiment. At best, it's a first glance—which way is up. Unless you go deeper into the data, all you're looking at is a mood ring.

ColorBrand Mood
GreenHappy
RedSad
GreyConfused

At the very least, you need to compare sentiment across brands and over time. Yay, it went up! Aw, it went down.

Oh, look, a mood ring. Maybe there's a secret decoder ring somewhere around here that we can wear next to it.

Set aside the methodology question
The automated sentiment debate continues, but I want to focus on what to do with sentiment data once you have it. On scoring methodology, remember that it's not a simple question of human vs. computer (though this Attensity post explains more of the automation than most people have probably seen). Most of the social media analysis (SMA) platforms I've just reviewed allow users to edit sentiment scores, so when you find a post with the wrong sentiment score, you change it. About half of the automated sentiment processors learn from users' changes, too.

But today's topic is what to do with the sentiment data you have.

Trends, segments, and causes
Sentiment, by itself, is a mood ring—a happiness indicator. It's nice to see the happy color, but there's not much information there. If you dig into the sentiment data, though, it starts to contribute to useful analysis.

Take the trend chart. Direction is interesting, but what about slope? Sudden changes are especially interesting. Any spike—not just in sentiment, but in volume or anything else—is the chart's way of saying "look over here." A spike on a chart is a big ol' why, waiting to be asked.

Sentiment really gets interesting when you combine it with other measurements. Most SMA platforms use sentiment scores as a filter for segmenting the data. What are the prominent and emerging topics within negative-sentiment content (and again with positive)? How does sentiment compare within a topic, across different media types or specific sources? Is a topic emerging from a source that writes negatively about you, or is it a friendly source?

Crafting queries and combining filters could be a whole series of posts, or maybe a book. That's why insight isn't automated: what you do next depends on what you find. If you're looking at the mood ring and wondering what it means, you haven't even started.

Join me at the Sentiment Analysis Symposium (New York, 13 April), where I'll talk about how to make an informed purchase decision in social media analysis.

Photo by abbyladybug

About Nathan Gilliatt

  • ng.jpg
  • Voracious learner and explorer. Analyst tracking technologies and markets in intelligence, analytics and social media. Advisor to buyers, sellers and investors. Writing my next book.
  • Principal, Social Target
  • Profile
  • Highlights from the archive

Subscribe

Monthly Archives