Recently in Methodology Category

As a visible project, The Analyst's Canvas is new, but it's been cooking for years. Now comes the fun part: working through the ways to use it. Today, let's talk about raw material: the data that go into the analytic process that leads eventually to information, insight and action.

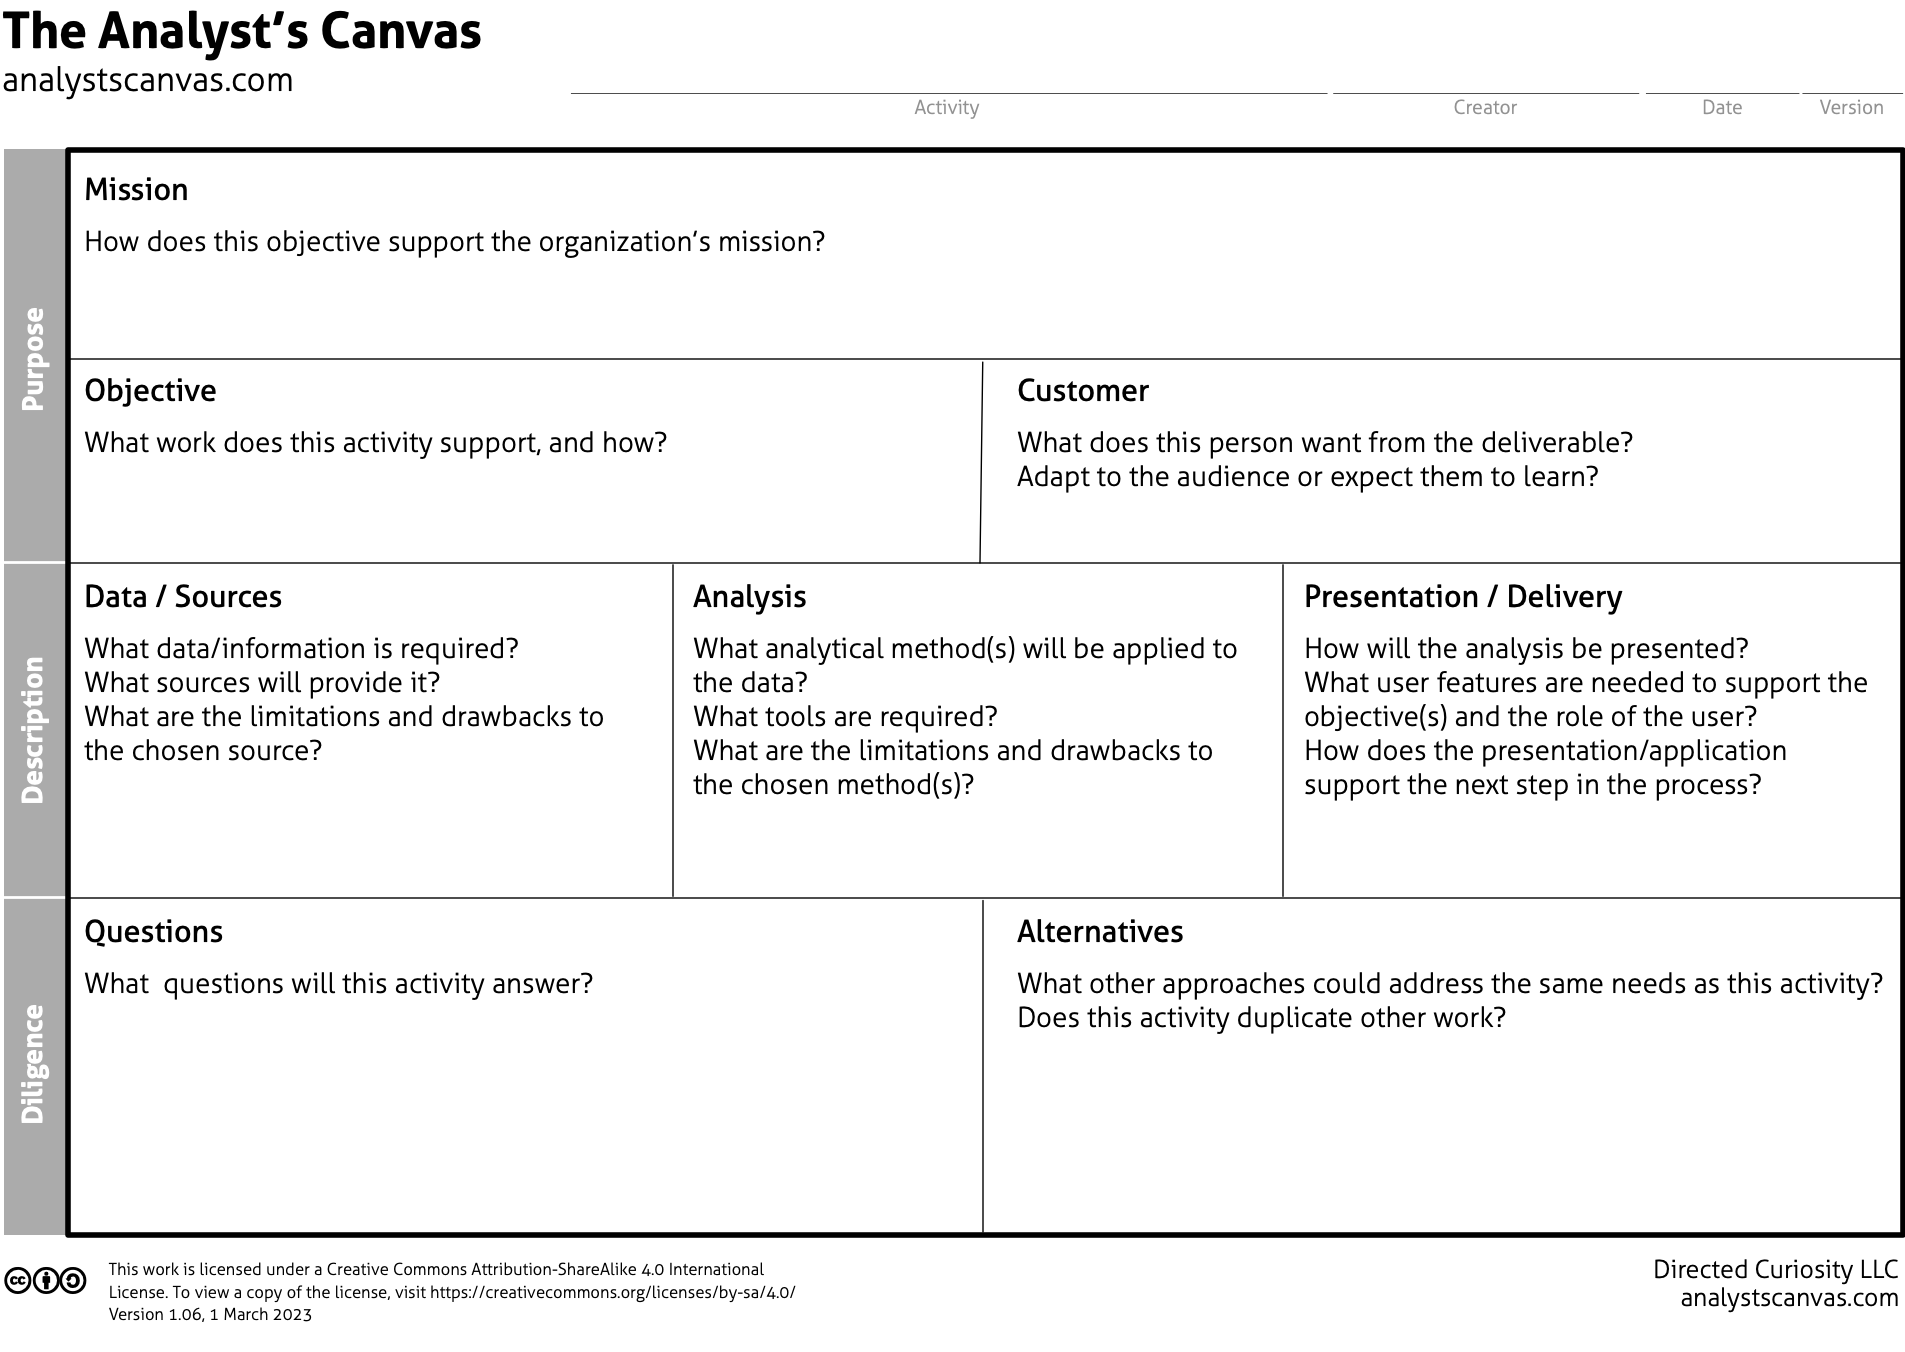
Look at the row of three boxes across the middle of the canvas: data / sources, analysis and presentation / delivery. In 2008, I used that basic outline to describe the building blocks of social media analysis. With the boxes empty, we have a framework to summarize many different tools and approaches. This row is labeled Description.

The analysts canvas captioned

The big idea of the canvas is to keep analytical work grounded with two of my favorite questions: what are you trying to accomplish, and why? Collectively, the boxes on the Description row characterize an intelligence or analytics process from source data to delivery, whether the finished product is a report, a software tool or something else. The row is below the Objective box as a reminder that the work has to support meaningful objectives.

I suspect that many discussions will take the components of an analytical play as a unit, especially since so many capabilities come packaged as turnkey tools with data, analytics and presentation built in. But whether building a new capability or evaluating an existing one, the three component boxes must be the right choices to support the Objective. It's not enough that the pieces work together, because we run the risk of developing elegant solutions to the wrong problems.

Using the canvas as a prompt
Every box is the canvas includes a set of basic prompts to initiate the exploration. The Data exploration begins with these:

  • What data/information is required?
  • What sources will provide it?
  • What are the limitations and drawbacks of the chosen sources?
  • Is this the right source, or is it just familiar or available?

Beyond the prompts, we can use the canvas to ask important questions about our preferred data sources:

  • Does this source contain the information needed to support the Objective?
  • Does the information from this source answer the questions we need to address?
  • What other/additional sources might better answer the questions?

Analyzing the canvas
If you look back at the canvas, you'll see that those questions address the relationship between one box (in this case, Data) and its neighbors (Objective, Questions and Alternatives). Its other neighbor, Analysis, is a special case. Depending on which you consider first, you might ask if the source contains the information needed for your analysis or the analysis is appropriate to the properties of the source.

Source to mission

In the first draft of the Explorer Guide, I included some suggested orders for working through the sections of the canvas for a few scenarios. In this exercise, I'm seeing something different: insights we can gain from the relationships across boundaries within the model. More to come.
Testing the Analyst's Canvas

Analyst's Canvas example flowI've just posted an Explorer Guide to the Analyst's Canvas. It's a longer explanation than last week's first look for anyone who's up for taking it out for a test drive. The canvas, you'll remember, is my new framework for thinking and communicating about analytical work in a way that doesn't imply a preferred set of tools and techniques.

It's all version one and subject to learning as we try it out. What I’m looking for first is reactions from people who aren’t me, because of course my own model works for me. The question is, does it make sense to anyone else?

If you're interested in joining the test phase, I suggest starting by completing a canvas for an existing service or use case. If you do a kind of analytical work that's not what you think I'm looking for, it's more likely exactly what I'm after. Establishing a common vocabulary to communicate across specialties is a major goal of the project, and I'm asking people from very different backgrounds to take a look.

The guide has some questions at the end, but any reaction is helpful. The process starts with downloads of the Analyst's Canvas and Explorer Guide (PDF). I can't wait to hear what you think.

Next: Mapping Data Sources to Objectives

First Look: The Analyst's Canvas

I was recently asked how I define media intelligence, which is a bit tricky because my definition starts with objectives rather than a list of capabilities. It's another industry term with the flexibility to reflect the priorities of the person saying it, so the answer is something like "what do you need it to be?" I also like to consider the client's job and next steps in the process: "what do you need to do with it?" This is "it depends" in a more actionable form. I don't lack a definition; it just operates at a higher level of abstraction than most.

In more than a decade of exploring methods of extracting meaningful information from diverse data sources to support diverse objectives, I've developed a framework for thinking about specific applications. I'm sharing it for the first time here (updated to latest version), and I'd like you to try it and tell me what you think.

The analysts canvas captioned

The Analyst's Canvas represents an idealized view of an activity, which you might label as research, analytics, or intelligence. My theory is that this abstracted perspective will support any kind of analytical work. The underlying philosopy is to focus on objectives and mission, prompting a consideration of alternatives and reducing the tendency to limit specialist methods to their organizational silos.

The three boxes in a row represent inputs, the analytical process, and outputs. In a software product, they represent data, algorithms and features. In a research project, they are data, analysis and deliverables. In an intelligence environment, they're sources, methods and deliverables. The upper sections ground the activity in the context of the client's or user's work and the mission that work supports. The lower sections clarify what the activity will produce and prompt a consideration of alternative methods.

What's the point?
I think that the Analyst's Canvas can be used to create value in a few ways:

  1. Organize and communicate requirements for new capabilities, using the mission and objectives sections to maintain focus.

  2. Communicate the value of a proposed or existing product or service, creating different canvases for each use case.

  3. Explore potential new markets for existing assets, such as data sources, analytical methods and presentation vehicles (it doesn't take much looking to find examples of each).
There may be other uses; this is what I have so far. For each application, expect a roadmap of how to apply the canvas, but that's not written yet.

My request: Try it.
I've run thought experiments on how the canvas might work in different contexts, and now I'm looking for the outside view. As I'm writing a fuller explanation of how it works and why, would you be willing to plug in your own scenarios as a test? I'd like to know what example you tried, what problems you ran into, and your opinion on its usefulness as a tool for both decision-making and communication.

Start with a blank version of the canvas (you'll find the Explorer Guide and other supporting material there, too). It's licensed under a Creative Commons Attribution / ShareAlike license, so if you like it, you're free to continue using it.

Eventually, I want to document some wildly different applications of the canvas to demonstrate its flexibility. Step one is trying it out in different environments.

Next: Testing the Analyst's Canvas

Story starterDo you have any of those mix-and-match books that let you remix parts of their pages? (It's ok; you can claim they're for your kids.) We once bought a story starter for my son (see, like that) that combines an opening quote, a character, and a situation. Put together a random grouping, and you have the beginning of a story.

That's sort of how I look at data and analytical methods.

Here's how it works: First, remember the basic building blocks of social media analysis: data, analytics, and application. Now, let's generalize from the social media example, because this isn't just about social media data.

We get three basic pieces:

  1. Data
    Internal and external sources, open (freely accessible) and proprietary (paid). There's a lot more here than most discussions get into.

  2. Analytic methods
    Sentiment analysis, topic clustering, source profiling, statistical analysis, geospatial analysis—the list goes on and on. This is a good area for And not Or thinking.

  3. Applications
    In a software business, this usually refers to the product, its features and their benefits. Here, though, think about the work that can be enabled through the application of data and analytics. Think about functional roles and what they need to do, and then you may get ideas about what a software application should do.
Put the three together, and you get data that can be combined with analytic methods to generate value in a particular application, or functional role.

We tend to get stuck in familiar modes of operation, thinking that a certain type of data implies a certain type of analysis, which is useful for a certain application. We fall back on social media + sentiment analysis + marketing. You might even think of it as a chemical reaction: social media + sentiment analysis -> value for marketing.

It's comfortable. It's familiar. It's not wrong. But there's more.

Time to mix it up
To find more value in the data and analytics, we need to start flipping the pages in the book. Which analytic methods could make this source of data useful for that function? I know what I know. What have I not yet found?

You can start with any piece first, and switching the order aids discovery. You might start with a functional role and ask what information would help them. You might start with a data source and think about how it might be useful. Or you could ask how an analytic method might turn data into something meaningful.

The secret is that each category has more options than you're probably using. More sources of data, inside and outside your organization. More analytic methods—some still being invented. More functional roles than the ones you're used to supporting.

Combine them, and you put familar data through unfamiliar analytics. New data through existing analytics. And you find ways to create value beyond the marketing, public relations, and customer service roles we associate with social media.

Do I have specifics? Sure, but not all in one blog post.

The mix-and-match book is similar to the Omniscience framework I proposed, which is all about understanding how intelligence and analytics can be useful at all levels in the organization.

CrowdFrom the first time I described the three buckets of social media data, I knew that one category was different. Content and activity analysis are built on the lessons from established schools of measurement, and while we argue about the specifics, the objectives aren't so alien. The last category—people data—seems more exotic, and it's the least discussed area of measurement. What do we do with data about people, then?

What are people data?
Social media data provide information about both individuals and groups of people: who they are, who they know, what they care about, what they have to say, where they go… Have you noticed just how much information people are sharing about themselves, both intentionally and unintentionally? Collect it from various sources, and you're looking at people data.

As I mentioned in the introduction post, the boundaries between categories aren't absolute, so you could look at much of the data that does into an analysis of people as either content or activity data. The difference comes about when we start thinking about the people as individuals or as identified groups—the focus is on the people, which is why it's useful to look at the data differently.

Analyzing data about individuals
When using the data to consider an individual, you have several basic options on how to approach the analysis. Remember to think and, not or; there's no value in deciding which approach is the right one until you have a specific objective.

  • Profiling
    Compile a detailed personal profile from multiple sources, merging multiple social account profiles with customer data and content analysis of the person's online activity. The resulting information could provide context to customer service agents or sales reps as they interact with the person.

  • Scoring
    Apply a model to rate someone's influence, authority, or relevance, which might help you prioritize efforts in blogger outreach. You might also view someone as a customer, scoring credit, lead strength, customer value, or loyalty.

  • Predicting
    Activity data linked to an individual might be useful for predicting future behavior. How good is your crystal ball?
Working with data about individuals always runs the risk of turning creepy. I'll get into the balance between privacy and the value of data another time, but be sensitive to the risks as you decide how to use information about individuals.

Analyzing data about groups
Zoom out from the individual view to think about the what the data can tell us about groups of people. First, we might identify different types of groups, and then we can develop profiles that communicate why we're interested in particular groups.

  • Identifying
    Groups come in various forms, both formal and informal. The easiest to profile are organizations with formal membership (which includes employers). More casual groups might form through social network sites, discussion forums, or meetup groups. Finally, we have the extended networks of indirect connections, some of which are conveniently entered into online social networks.

    We might also find value in virtual communities implied by some characteristic, from interest in a common topic to locations, both real and virtual. How information travels in such a community could be useful to understand.

    I've had some interesting conversations on the subject of social network analysis, and how its use in social media isn't necessarily in sync with the science on social networks (in the original, not online, sense). If you understanding that you're mapping something other than social relationships, though, I think there's underdeveloped value in applying network analysis to more data points.

  • Profiling
    Profiling a group is less likely to turn creepy than individual profiling, but there's still a right way to do it. First, describe how the group was identified; for some uses, that may be all the information you need—if you're developing a targeted marketing promotion, for example. Going deeper, think about what the group is interested in and where they go (online and in the real world). Who are their leaders—and what is leadership within the group? What's important to them, and what's their history?

    Before you interact with a group, make an effort to understand their norms. The unwritten rules vary by community, and what works in one setting can be precisely wrong in another. As you work to understand and interact with groups, you're dabbling in anthropology, so you might consider its methods.

Our society is producing an astounding amount of data about people, both as individuals and in groups. It's easy to cross the line into overly intrusive use of the data, but it's hard to find a common definition of where that line is. That's a topic I plan to explore in depth in the coming months.

Photo by James Cridland.

DashMonitoring social media. Measuring social media. Social media analytics. All of these treat social media as data, but social media generate at least three types of data: content, activity, and people. In the last post, I wrote about content data, which is the starting point for listening. This time, let's talk about activity. What are people doing that we can analyze?

What is activity data?
Activity data is just what it sounds like: data about the behaviors of people as they use social media. When we're tweeting, pinning, tagging, posting, commenting, sharing, and liking, the systems we watch are watching us back. It's like web analytics, except that social media support many more activities than most web pages, and the activity takes place on social media sites instead of companies' own web sites.

Analyzing activity data
If you're used to measurement conversations with an unstated assumption that you're talking about content data, you probably talk a lot about sentiment and topics. If you listen to web analytics folks talk about social media for a few minutes, you hear about entirely different metrics: friends, followers, fans, likes, shares, retweets, and more.

Compared to content data, activity data presents a set of harder metrics, meaning there's not much doubt about the actual numbers. They're based on observing the use of features built into the software, rather than an interpretation of someone's writing. There's little ambiguity in clicking on a Like button, for example. It's either been clicked or not. The real question is what that means.

An embarrassment of metrics
The challenge in using activity data is less about the underlying technologies and more about tying them to business objectives. We have a lot of available metrics to choose from, and to complicate things, similar-sounding metrics from different social media sites can't always be compared. Always start with the most important question ("what are you trying to accomplish?"), and be sure you understand what the metrics really represent.

With activity data, the web analytics folks have an advantage, because their existing metrics tend to be closely tied to business performance. They already measure how well their web properties generate interest, leads, and sales. It's not too much of a stretch to extend the marketing funnel to include social media properties, too.

Besides its effectiveness in leading customers directly to the e-commerce store, you might measure social media activity as evidence of customer or community connections (engagement), or think of users as an audience for your messages (reach). Some metrics may have value with minimal interpretation, such as product ratings scores. Any tactic you employ that is designed to lead to an action has the potential to be evaluated with activity data, so—again—what are you trying to do?

Lines that go up and to the right make for successful presentations, if you understand what the line represents and how it relates to the business. Activity data can give you those charts; all you have to do is pick the right metrics. And as you're considering metrics, remember the three types of social media data.

Next: Working with Social Media Data: People and Groups

Screen capture by Darren Krape.

typing.jpgBefore you can analyze, you need data. In thinking of what you can do with social media data, I find it helpful to think about three buckets of social media data: content, activity, and people data. Let's talk about content. If you look at social media from one angle, that's what it is: lots of content. What do you do with that?

What is Content Data?
When we talk about listening and how people express their opinions, we're talking about working with content data. From the text of tweets, blog posts, and product reviews to pictures, videos, and audio recordings, content is everything that people are posting and sharing online. When people ask about sentiment, opinion, and complaints, they're asking about content.

Analyzing Content Data
Remember consumer-generated media? That was the mindset in 2006 when I started looking for companies that worked with social media data. People were empowered by these new, "Web 2.0" technologies to share their thoughts and opinions with a global audience. The companies they talked about suddenly needed to pay attention, and the existing paradigm with the closest fit was media analysis. So, much was borrowed.

The media analysis world was about understanding media coverage, when media meant professional writers and paid publications. You could count things: how many articles mentioned you, how many times were you mentioned within articles, and how did that compare with the competition. You could rate mentions as favorable or not, and you could see if your messages were picked up by journalists. There's more to it, but you get the idea.

It turns out that a lot of established media analysis techniques work for consumer-generated media, too. The challenge is that the new media sources generate a lot more content, so you need to sample the data or automate the process to keep up.

The other paradigms that usually enter discussions of content data are opinion research and the customer service queue. You can hardly turn around without running into these, "the world's largest focus group" and the new channel where customers expect a response.

Turning Content Into Usable Data
The promise of all this content is that people are sharing their thoughts with anyone who pays attention. The challenge is in turning the data into something that can be analyzed. That's where we get into coding the data—scoring it for sentiment, identifying the topics and entities (such as people or companies) discussed, rating the opinions and emotions expressed. It's hard work, especially when you consider the need to work with foreign languages.

In the case of text—posts, tweets, and the like—turning raw text into usable data is the job of text analytics. Whether they use statistical approaches that compare new texts to previously scored texts, or they parse the grammar to "read" the content, text analytics systems take text in and give coded, structured data out. From there, the processing gets easier.

All content is not text, but more of it could be. Back in the professional media world, you might be able to get transcripts or closed-caption data to augment video content. Beyond that (and even deeper into the research lab than text analytics), you can find systems that extract speech from audio and video, converting it to text for further analysis. Finally, most content sources include hidden metadata, such as topic tags and author information, that adds context and clues for analysis.

There's a lot to content analysis, which is why it's a growing specialty. I've spent a lot of time blogging about it here over the years, too. But if we step back and look at the big picture, it's only one of three types of social media data.

Next: Working with Social Media Data: Activity

Photo by Michael Sauers.

buckets of berriesIn preparing for last month's Social Media Analytics Summit, I needed a talk on the emergence of the social media analytics industry—which was tricky, since I don't usually talk about social media analytics. I didn't want to set up an elimination round of buzzword sweepstakes, arguing for this usage or that. Instead, I looked for a unifying theme, which led to a new question and three categories of social media data.

I've used a disappointment setup in my presentations for a while. "What's the best tool?" "It depends." The point is to get people thinking about what they're trying to accomplish, rather than jumping on the bandwagon for a popular tool. One of the questions I've suggested is "how do you measure social media?" There's an assumption hiding in that question, which became a limitation when I tried to update my slides. I needed a better question.

What can you do with social media data?
The key was to focus on the basic building blocks of analytics: data, analytics, and application. We tend to focus on the analytics technologies and the end-user applications, but what about the data? What if we focus on social media as a source of data? Ah, there we go.

What kind of data do social media give us to work with? If you look at the various specialists working the question, I've found three basic categories:

I'll go into each of these categories in the next few posts, but first, let's acknowledge that these are not rigid boundaries. Mixing data types and analytics lenses is definitely something to encourage, but if we want the data types to play together, we should understand what they are, first.

Next: Working with Social Media Data: Content

Photo by hugovk.

It started with a simple challenge: if I were to draw a big circle around the things I find interesting enough to follow and declare them to be one thing, how would I label it? To avoid flying completely off into pointless musing, assume that it's relevant professionally. Considering that the circle included social media, analytics, intelligence, geopolitics, and natural disasters—to pick a few—the label wasn't obvious. By declaring them to be one thing, though, it soon became clear that the theme was the importance—the value—of knowledge.

The label was Omniscience.

"That's pretty ambitious."
Yes, I'm aware of the definition of omniscience, and no, I'm not suggesting that I know everything or ever will. But among the unattainable goals, it's a good one. I mean, what could you do if you knew everything? You can't, but what if you knew a lot more about things that matter to your business?

What if you knew something that was there to be discovered, and your competitor didn't? Is it starting to sound reasonable yet? Maybe even something you'd want to do?

The framework
I've talked through the Omniscience framework with several folks for early reactions, mostly in person. It involved some handwaving, so I knew it wasn't ready to post. Some people suggested related books, but nobody really shot it down. Now, it's your turn (click for a larger view). I'm not sure I need a lot more assigned reading at the moment, but I'm definitely interested in your reaction.

Omniscience overview

A framework, not a recipe
This is the top-level view, and each section has a story, a purpose, and examples. But this is the gist of it: starting with a few simple observations on the nature of things, Omniscience is a challenge to expect more of your intelligence and analytics, drawing on a broader range of techniques to track and anticipate a wider range of things that matter.

Omniscience provides a thread. It links things you know with things you do—and with things you don’t do. It links the very large and the very small, the short-term and the long-term. The way you think and plan and the way you measure and evaluate. It provides a structure to identify missed opportunities and to evaluate new ideas. And although it looks highly theoretical, it's already suggested a practical application that I haven't seen on the market.

Naturally, I think it's a big deal. Does it make sense to you, so far?

In my last post, I suggested that intelligence and analytics are two angles on the same challenge: developing the information value in available data. You're probably already looking—sorry, listening—for useful information online. Rather than thinking of intelligence and analytics as separate specialties, let's approach them as two lenses that might help us find information in data.

I'm going to risk a small definition here; if I'm going to write about intelligence and analytics, it would help if I assert that these aren't two words for the same thing. Proposing a formal definition isn't my point, so let's think about it this way: We do a lot of quantitative analysis these days. We care about the results because they present trends or aggregate data points in some way. For the purposes of this discussion, that's analytics. Other times we care about individual facts, regardless of the quantitative view. That's intelligence (cue James Bond theme).

For example, you might be interested in the most popular adjectives used to describe your product or brand. You care about the results because they represent mass opinion. That's analytics. Conversely, if you discover a death caused by your product, that fact is important regardless of how many people are talking about it. That's intelligence.

Yes, it's a little messy. The point is to notice what we've been missing, not to perfect the language.

What do people say?
Let's apply this to the familiar topic of listening in social media. People say all sorts of things online, but when we start analyzing their meaningful statements, they fall into two categories: statements of fact (which may be false) and statements of opinion.

We spend a lot of time on the notion of analyzing opinions. Most of the usual metrics help us understand trends in the opinions expressed in a large collection of comments. But what about facts? What do we do about them? They don't really fit into a market research paradigm, but some of them may be important to the business. We need to use a different lens.

It must be serious; he has a matrix
In proper consultant fashion, I decided to see what happens when we put these two ideas in a matrix. We use our intelligence and analytics lenses to look at statements of fact and statements of opinion online. Remember, analytics (in this discussion, at least) is about aggregate data, while the intelligence lens can pick up isolated signals. The examples in the boxes are illustrative; I'm sure you can think of more.

Intel analytics grid

Think about the usual discussion of listening in social media. How much of it focuses on measuring customer opinion and brand image (including every discussion of the accuracy of sentiment analysis)? How much more value could we uncover if we asked more questions of the same data? Are you looking for the important signals that don't show up in a Top 10 chart?

This is another piece of the Omniscience framework I'm working on. It starts with four simple thoughts, and it all comes together eventually—I hope.

About Nathan Gilliatt

  • ng.jpg
  • Voracious learner and explorer. Analyst tracking technologies and markets in intelligence, analytics and social media. Advisor to buyers, sellers and investors. Writing my next book.
  • Principal, Social Target
  • Profile
  • Highlights from the archive

Subscribe

Monthly Archives