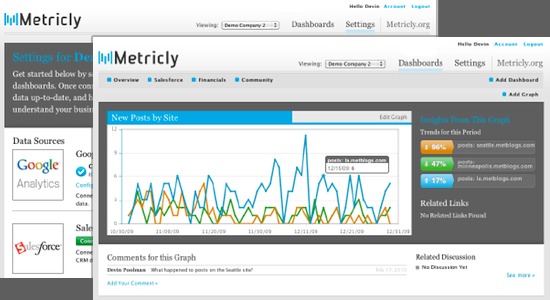
 Too much information. And increasingly, too many disparate sources of data, many with their own analytical tools. So it's interesting to see a new crop of startups offering tools that pull analytics data from multiple sources into a single dashboard for analysis and reporting.
This is one of those posts that started as a more detailed look at a few tools, but as I was looking around, more platforms kept popping up on the radar. So it's become a list, which is probably just as well. Some of these guys are semi-hidden in beta testing, so any detailed description is going to be out of date soon, anyway.
If you're spending too much time trying to corral performance data from multiple online sources, try these on for size:
- Anametrix
- Cyfe
- DigMyData
- Ducksboard
- Geckoboard
- Informly
- Leftronic
- Metricly
- Social Report
- Source Metrics (formerly Swix)
- Sprout Social
- StatsMix
- Unilyzer
Analytics mashup
What these platforms have in common is the ability to create charts and dashboards that combine data from web analytics and social media sources (Leftronic is different, because of its emphasis on large-screen dashboards for public view). So if you want to see the correlation of Twitter followers and website visitors, you can. If you want to track multiple accounts on one dashboard, you can. If you want to stir in data from your internal databases, some of them will let you do that, too.
What if
Remember the RSS tricks post from a couple of years ago, how you can assemble useful applications by using RSS inputs and outputs as a pipeline between services? With so many APIs going in and out these days, one of these dashboards could be the user interface for some interesting manipulations. For example:
What if you were to combine online sources (social media) and internal company data, run them through some text analytics, and pipe selected metrics out to one of these dashboards to mash them up with web analytics (which you've already linked to business performance). Would you find the elusive social KPI you've been looking for?
It's a list. I've missed somebody. Tell me, and I'll add them.

Thanks. Never knew these sites existed until this post. Time to check them out!
"What if you were to combine online sources (social media) and internal company data, run them through some text analytics, and pipe selected metrics out to one of these dashboards..."
That's what we do - Feedback Ferret provides sophisticated contextual analysis of Voice of Customer feedback comments, whereever the feedback comes from. We consolidate these multiple feedback sources to a single platform and run the Feedback Ferret text analysis engine to understand the themes, topics and sentiment of the things that people are talkig about, so that the organisation can make improvements in products and service to meet customer needs. Interactive dashboards present not only the text analysis results, but can also combine other KPIs and business performance metrics such as sales performance, mystery shopping, queue times, etc, into a concise business information source.